Wifi
Complete Guide to NAS for Beginners: What to Know
Discover everything about NAS for beginners, including setup, best brands, storage tips, and whether a NAS is right for you.
Compare RSSI, SNR and signal loss to diagnose WiFi issues, optimize access point placement, and reduce interference for stable voice, video, and data.
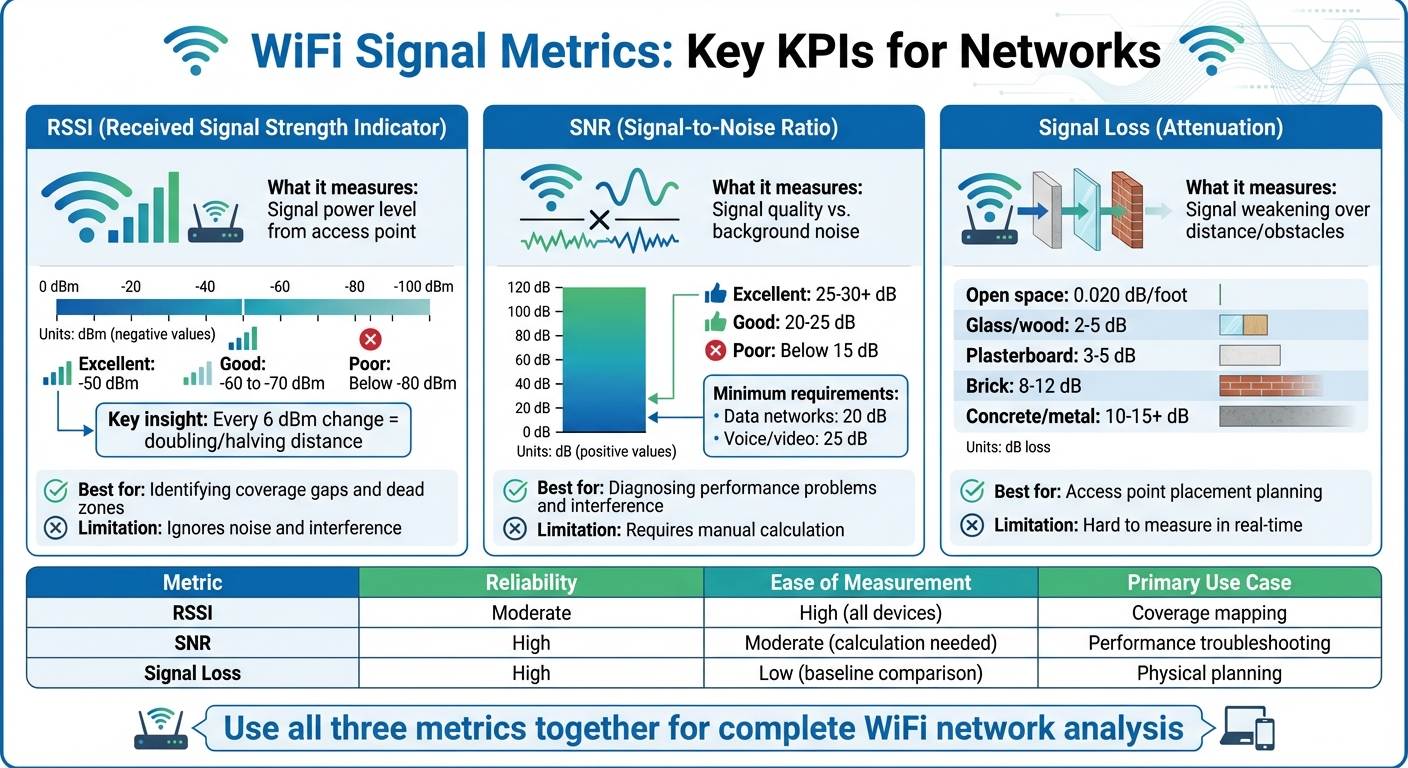
WiFi performance boils down to three critical metrics: RSSI (signal strength), SNR (signal quality), and signal loss (attenuation). These metrics help diagnose slow connections, dropped calls, or dead zones. Here's what you need to know:
Understanding these metrics helps you troubleshoot issues, optimize device placement, and improve overall network performance. Small adjustments like repositioning access points or switching channels can make a big difference.
WiFi Signal Metrics Comparison: RSSI vs SNR vs Signal Loss
RSSI (Received Signal Strength Indicator) measures the power level received by your device from an access point. It's expressed in negative decibel-milliwatts (dBm), with values typically ranging from 0 dBm (strongest) to -100 dBm (unusable).
An RSSI near -50 dBm indicates excellent signal strength, while values between -60 and -70 dBm are considered acceptable. However, when the RSSI drops below -80 dBm, connection stability often suffers.
Interestingly, every 6 dBm change in RSSI is roughly equivalent to doubling or halving the distance between your device and the access point. Eric Camulli, VP and Customer Success Officer at 7SIGNAL, explains it well:
"Every 6 dBm change has an impact that's roughly equivalent to doubling the distance between the endpoint and the access point."
Physical barriers like concrete walls, metal objects, and brick can weaken the signal, causing a noticeable drop in RSSI. But signal strength alone doesn't tell the whole story - ambient noise plays a big role in determining overall signal quality.
RSSI reflects the total power received, including both the desired signal and any background interference or noise. For example, if your RSSI is -65 dBm and the noise floor is -70 dBm, the 5 dB difference could lead to data errors and retransmissions. To combat this, modern WiFi 6 (802.11ax) routers use BSS Coloring technology, which helps devices ignore interference from nearby networks. This ensures better performance even when the raw RSSI isn't ideal. However, it's important to remember that RSSI measures signal strength, not its quality.
While signal strength and noise levels set the stage, connection stability depends on maintaining consistent thresholds. Many network administrators establish "Minimum RSSI" thresholds, often around -70 dBm, to prevent devices with weak signals from connecting. This reduces transmission failures and boosts network performance. For voice applications, a minimum of -65 dBm is critical, while general data networks work well at -80 dBm or better. Even minimal packet loss - just 1% - can disrupt real-time applications like video conferencing.
Improving RSSI starts with smart access point placement. Position access points centrally and at higher elevations to minimize obstacles and maximize coverage. Choosing the right frequency band for your environment can also improve RSSI. Tools like WiFi analyzers can help identify less congested channels, and moving access points away from interference sources like microwaves or cordless phones can further enhance performance. High-quality antennas and beamforming technology can direct signals to specific devices without increasing the overall transmit power.
SNR, or Signal-to-Noise Ratio, measures the difference between the strength of the received wireless signal (RSSI) and the surrounding noise floor. While RSSI shows how strong a signal is, SNR reveals the quality of the connection by indicating how well the device can separate actual data from background interference. It’s expressed in decibels (dB) as a positive number, typically ranging from 0 to 120 dB.
A strong RSSI doesn’t always mean a reliable connection. Cisco Meraki provides a helpful example:
"A received signal of -65 dBm can be considered good at a location that has a noise floor of -90 dBm (SNR 25 dB) but not so much at a location with a noise floor of -80 dBm (SNR 15 dB)."
This shows how the same RSSI value can lead to different SNR levels depending on the noise in the environment. To calculate SNR, subtract the noise floor from the RSSI. For instance, a -65 dBm signal with a -90 dBm noise floor results in an SNR of 25 dB. However, most standard laptop WiFi cards can’t measure the noise floor directly. For precise measurements, tools like MetaGeek inSSIDer are recommended.
Background noise from devices such as microwaves, cordless phones, and baby monitors can lower SNR and harm network performance. When SNR drops, devices struggle to separate data from interference, leading to errors, frequent retransmissions, and slower network speeds. Typical noise floor levels range between -90 dBm and -98 dBm, but anything above -60 dBm is considered excessively high and can severely degrade performance [10, 13].
For standard data networks, an SNR of at least 20 dB is required, while voice applications demand a minimum of 25 dB to avoid issues like jitter and packet loss. High-performance networks aim for an SNR between 25 and 30 dB. When SNR falls below 15 dB, expect frequent disconnections and very slow speeds. While data transfers can handle up to 3% packet loss, a retry rate exceeding 30% is a clear sign of interference or channel congestion [1, 6, 11].
Boosting SNR begins with identifying and addressing interference. For example, if an access point shows high channel usage but low user traffic, non-WiFi devices like microwaves or radar could be the problem. While increasing transmit power or using higher-gain antennas can help, reducing ambient noise is the most effective solution. Steps to improve SNR include relocating access points away from interference sources, minimizing physical barriers like concrete or metal, and choosing less crowded channels. In high-density setups, where frame rates might exceed 200,000 per minute, redistributing access points to balance the load can also make a big difference. These adjustments not only enhance SNR but also tie into broader network performance strategies discussed earlier. Up next, we'll compare these metrics to evaluate their strengths and limitations.
Signal loss, or signal attenuation, is the gradual weakening of a WiFi signal as it travels through space or encounters obstacles. Unlike RSSI and SNR, which capture real-time signal conditions, signal loss focuses on the cumulative reduction in signal strength from the access point to your device.
In open spaces, WiFi signals typically weaken by about 0.020 dB per foot. However, physical barriers significantly accelerate this loss. For example:
To put this into perspective, a signal measuring –50 dBm near an access point can drop to –80 dBm after passing through just two concrete walls. This shift can turn a strong connection into one that's barely functional.
As signal loss pushes your connection closer to the noise floor (background interference levels), the risk of data corruption increases. Cisco Meraki explains:
"The further a received signal is from the noise floor, the better the signal quality. Signals close to the noise floor can be subject to data corruption, which will result in retransmissions between the transmitter and receiver."
These retransmissions slow down your connection. General data transfers can usually handle up to 3% packet loss, but voice and video calls degrade noticeably with just 1% loss. Additionally, a retry rate above 30% suggests severe interference or channel overload. For real-time applications like VoIP, network jitter should stay below 20 milliseconds; anything higher can cause significant disruptions.
Minimizing signal loss starts with thoughtful access point placement. Ideally, position APs at ceiling height (9–12 feet in office settings) with a clear line of sight to devices. Reducing obstacles like concrete, brick, and metal can also make a big difference.
Choosing the right frequency band is another key factor. The 2.4 GHz band provides longer range but is more prone to interference, while the 5 GHz band delivers faster speeds over shorter distances with less congestion.
Finally, calculate EIRP (Effective Isotropic Radiated Power) using this formula: Transmit Power – Cable Loss + Antenna Gain. This calculation helps you understand the actual signal strength leaving the access point, factoring in system losses. By addressing signal attenuation, you can improve network performance and better evaluate the strengths and limitations of different metrics.
When it comes to evaluating WiFi performance, each metric serves a specific purpose. RSSI is great for spotting dead zones and identifying basic coverage gaps because it's supported on almost every WiFi-enabled device. However, its scope is limited - it measures only signal strength, not quality. As NetSpot puts it:
"RSSI measures only the strength of the signal - not its clarity or reliability."
This means relying solely on RSSI might not give you the full picture of your network's performance.
On the other hand, SNR stands out for assessing connection quality. By factoring in background interference, it gives a clearer view of how well your network can handle high data rates. This makes it a go-to metric for troubleshooting slow speeds in environments with a lot of noise. The downside? Calculating SNR often requires manual effort, as most operating systems don't report it directly.
Shifting focus to physical network planning, signal loss becomes crucial. It helps explain why signals weaken over distance or when passing through obstacles, making it invaluable for determining the best placement of access points. However, measuring signal loss in real-time is tricky - you need to compare the transmitted power against the received strength.
Together, these metrics give a well-rounded view of both connection quality and the physical behavior of your network.
| Metric | Reliability | Ease of Measurement | Network Impact | Primary Weakness |
|---|---|---|---|---|
| RSSI | Moderate | High (standard on all devices) | Indirect; indicates potential for connection | Ignores noise and interference |
| SNR | High | Moderate (requires calculation) | Direct; determines maximum data rates | Not natively reported by most operating systems |
| Signal Loss | High | Low (requires baseline comparison) | Direct; reduces overall signal reach | Hard to isolate from interference |
For practical use, SNR is ideal for diagnosing performance problems, while RSSI is better for mapping coverage areas. This comparison highlights which metric to focus on depending on your specific troubleshooting or planning needs.
Understanding RSSI, SNR, and signal loss gives you a clearer picture of your WiFi network's overall performance. RSSI pinpoints coverage gaps and dead zones, SNR sheds light on interference affecting connection quality, and signal loss highlights the importance of router placement. Together, these metrics take the mystery out of diagnosing network issues.
For instance, if you're dealing with dropped connections in certain areas, check your RSSI values. Anything below -80 dBm indicates poor coverage and the need for improvement. On the other hand, if your signal strength is fine but your internet feels sluggish, interference might be the culprit. As previously noted, an SNR of at least 25 dB is essential for smooth voice and video applications. These benchmarks guide practical steps for improving your network.
Simple adjustments can go a long way in reducing interference and signal loss. Keep your router away from microwaves, cordless phones, and metal objects. Switching to less congested channels or upgrading to Wi-Fi 6 can also minimize noise.
In more complex environments - like multi-story homes or offices with thick walls - professional help can make a difference. TekDash offers on-site network analysis and optimization. Their certified technicians can identify ideal access point placements, eliminate dead zones, and fine-tune your network for peak performance.
Whether you're tackling issues solo or calling in the pros, RSSI, SNR, and signal loss provide the tools you need to create a faster, more dependable WiFi network.
To improve your WiFi signal strength and cut down on interference, focus on optimizing two important factors: RSSI (Received Signal Strength Indicator) and SNR (Signal-to-Noise Ratio). Ideally, your RSSI should be stronger than -70 dBm, paired with a high SNR for dependable performance.
Start by placing your router in a central, elevated spot to ensure better coverage. Keep it away from walls, metal objects, and other electronics that might disrupt the signal. Switching to less congested channels can also help reduce interference from nearby networks.
Don’t overlook your router's firmware - keeping it updated is key to maintaining smooth performance. If you’re still facing connectivity issues, try using signal measurement tools to pinpoint weak areas in your network. And if troubleshooting on your own feels overwhelming, professionals like the certified technicians at TekDash can assist with setup, diagnosing problems, and even extending your network’s reach.
RSSI (Received Signal Strength Indicator) measures the strength of a WiFi signal when it reaches your device. The closer the value is to 0 dBm, the stronger the signal.
On the other hand, SNR (Signal-to-Noise Ratio) evaluates the quality of the signal by comparing its strength to the level of background noise. Higher SNR values - closer to 120 dB - indicate a clearer, more reliable connection.
Both metrics play a key role in assessing and improving your WiFi network. While RSSI shows how well the signal reaches your device, SNR provides insight into whether the connection is stable and clear enough for smooth performance.
WiFi signals can struggle when they encounter physical barriers like walls, concrete, or metal objects. These materials block or reflect the electromagnetic waves, which weakens the signal. The result? Slower internet speeds and unreliable connections.
Denser materials, such as brick or concrete, cause more interference than lighter ones like drywall. To get better performance, position your router in an open, central spot with as few obstructions as possible.
Discover everything about NAS for beginners, including setup, best brands, storage tips, and whether a NAS is right for you.
Smart router placement, channel tuning, and moving devices to 5/6 GHz eliminate workplace WiFi interference and restore reliable connectivity.
Fix delayed video doorbell alerts by improving Wi-Fi (check RSSI), disabling phone battery optimization, updating firmware, and optimizing your...